Two Tools, Different Jobs
Every Ontario plant manager eventually asks the same question: should we invest in vibration analysis or thermography? The honest answer is that they solve different problems, and most plants need both. But if you're starting from zero and have to pick one, the decision depends entirely on what's failing in your facility.
This isn't a "both are great!" non-answer. We'll give you a clear decision framework so you can spend your maintenance budget where it actually prevents downtime.
Not sure which method fits your equipment? Talk to one of our engineers — we'll assess your failure history and tell you where to start.
What Each Method Actually Detects
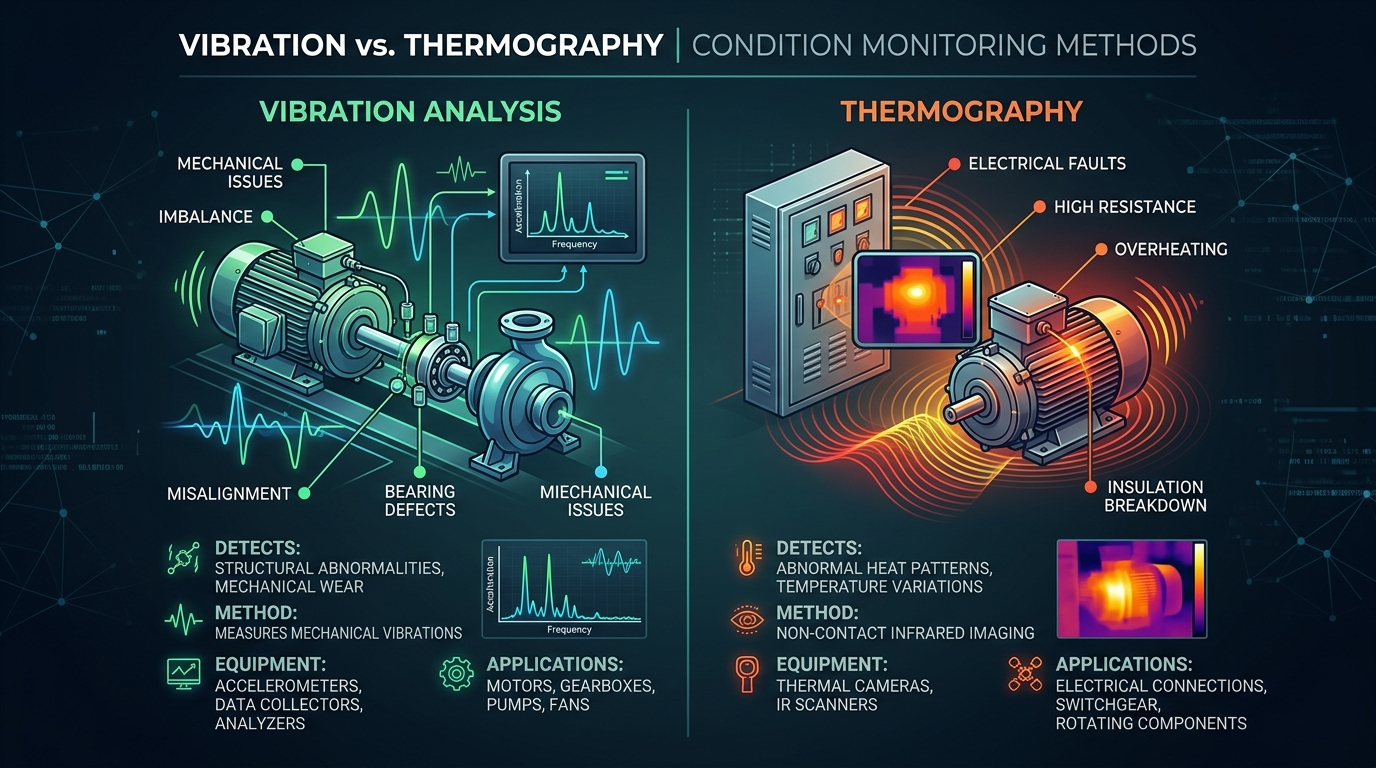
Vibration Analysis
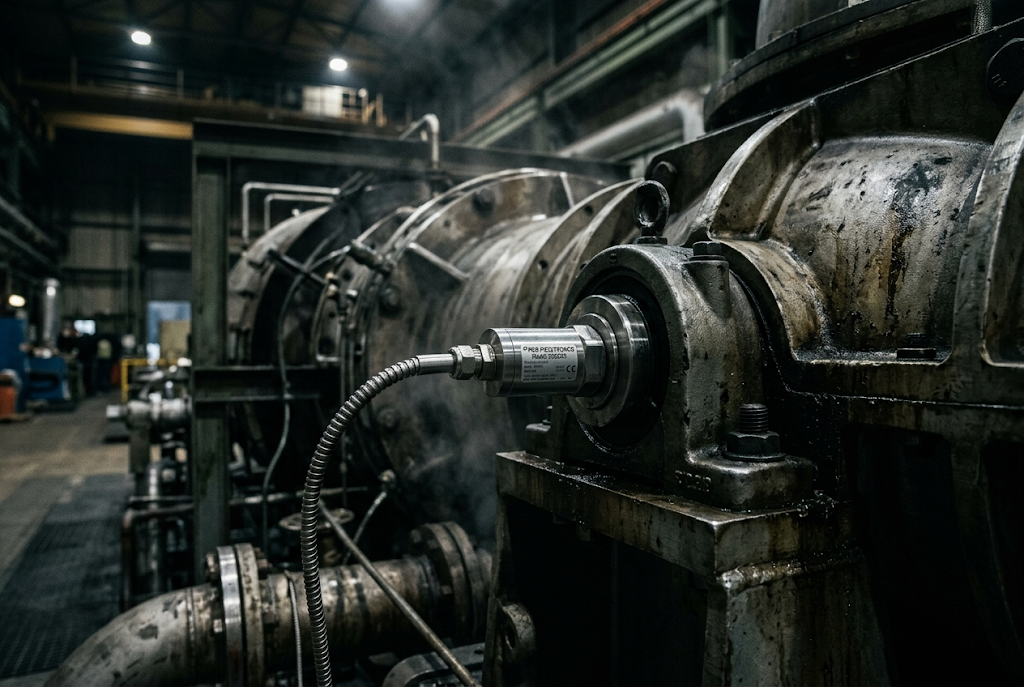
Vibration analysis measures the mechanical motion of rotating equipment. Accelerometers mounted on bearings, housings, or structures capture vibration signals, and analysts interpret the frequency content to identify specific faults.
Detects:
- Bearing wear (inner race, outer race, rolling element, cage faults)
- Shaft imbalance
- Misalignment (angular and parallel)
- Mechanical looseness
- Gear mesh problems
- Resonance issues
- Belt defects
Does not detect:
- Electrical faults in switchgear or connections
- Insulation breakdown (thermal, not mechanical)
- Steam trap failures
- Process blockages or fouling without mechanical symptoms
Thermography
Infrared thermography uses thermal cameras to detect temperature differences across equipment surfaces. Hot spots indicate problems — overloaded circuits, failing connections, blocked heat exchangers, insulation gaps.
Detects:
- Loose or corroded electrical connections
- Overloaded circuits and breakers
- Motor winding insulation degradation
- Steam trap failures (blow-through vs blocked)
- Refractory lining damage
- Roof moisture intrusion
- Process temperature anomalies
Does not detect:
- Bearing defects (until the very late stages)
- Shaft misalignment
- Imbalance
- Gear wear
- Any fault in its early stages — thermography typically shows problems weeks before failure, not months
The Decision Matrix
| Factor | Vibration Analysis | Thermography | |---|---|---| | Best for | Rotating equipment (motors, pumps, fans, gearboxes) | Electrical systems, thermal processes, building envelopes | | P-F interval | 1-9 months | 1-4 weeks | | Early detection | Catches faults months in advance | Catches faults weeks in advance | | Equipment contact | Requires sensor contact or close proximity | Non-contact (can scan from metres away) | | Speed of survey | 15-30 min per machine | 2-5 min per panel/asset | | Analyst skill required | ISO Cat II minimum (significant training) | Level I thermographer can handle 80% of surveys | | Cost to start | Higher (analyser + sensors + training) | Moderate (camera + training) | | Ontario regulatory alignment | CSA Z463 motor maintenance | ESA electrical inspections, Ontario Fire Code |
When to Choose Vibration Analysis First
Start with vibration analysis if your plant has:
- Large rotating equipment — motors above 25 HP, centrifugal pumps, fans, compressors, turbines. These are the machines where unplanned failures cost $50,000-$200,000 per event.
- A history of bearing failures — if you're replacing bearings reactively more than twice per year on critical equipment, vibration analysis will catch those faults 3-6 months earlier.
- Continuous production lines — when a single motor failure stops an entire line, the P-F interval matters. Vibration analysis gives you months of warning. Thermography gives you weeks. Months wins.
- Gearboxes — thermography can't see inside a gearbox. Vibration analysis can identify individual gear mesh faults, bearing defects, and shaft problems without opening the casing.
For a deeper look at what vibration analysis catches and how it works, read our complete guide to vibration analysis in Ontario manufacturing.
When to Choose Thermography First
Start with thermography if your plant has:
- Aging electrical infrastructure — if your switchgear is 20+ years old (common in Ontario facilities built in the 1970s-80s), thermal scanning of electrical panels prevents arc flash incidents. This is a safety issue, not just a maintenance issue.
- Steam systems — failed steam traps waste 15-25% of steam energy. A single thermographic survey can identify every failed trap in your facility in one day. The energy savings alone pay for the programme in months.
- Large building envelope — if you're managing a facility over 50,000 sq ft and your heating costs are climbing, thermal imaging finds insulation gaps, air leaks, and moisture intrusion that you'd never find visually. Ontario winters make this a significant cost factor.
- Food processing or pharmaceutical — where temperature control is part of your quality system, thermography provides documented evidence of thermal compliance.
Running an Ontario plant with both rotating equipment and aging electrical? Talk to an engineer about a combined programme — the survey costs drop 30% when you bundle both methods on the same visit schedule.
When You Need Both (Most Ontario Plants)
Here's the reality: a typical Ontario manufacturing facility has 50-200 motors, dozens of electrical panels, a compressed air system, and some form of process heating or cooling. No single monitoring technique covers all of that.
The practical approach:
- Vibration analysis on your top 20-30 critical rotating machines — the ones where failure costs more than $10,000 or creates a safety hazard.
- Thermography on all electrical distribution (MCC panels, transformers, switchgear) plus steam traps and any thermal process equipment.
- Combined routes — schedule vibration and thermal surveys on the same visit cadence. Your analyst walks the plant once per month and collects both data sets.
This isn't about spending more money. It's about covering the two failure modes that cause 85% of unplanned downtime in Ontario manufacturing: mechanical faults (vibration) and electrical faults (thermography).
The One Thing Both Methods Agree On
Calendar-based maintenance is the most expensive way to maintain equipment. Whether you start with vibration analysis, thermography, or both — you're moving toward condition-based maintenance. You're making decisions based on what's actually happening inside your equipment, not what a spreadsheet says should happen based on an arbitrary time interval.
The plants that get this right spend 40% less on maintenance and have 60% fewer unplanned shutdowns. That's not a projection. That's 20 years of field data from facilities across Ontario.
Your Next Step
You don't need to figure this out alone. Droz Technologies delivers predictive maintenance programmes across Ontario — vibration analysis, thermography, oil analysis, and full programme development.
Tell us what's been failing, what it's costing you, and what equipment you're running. We'll recommend the right monitoring strategy — not the most expensive one, the right one.